
Statistical Process Control 101: A Key to Superior Quality Control

In the sphere of quality control and process improvement, one methodology stands out for its effectiveness and precision: Statistical Process Control (SPC).
Peter Drucker once said, “ If you cannot measure it, you cannot manage it,” and SPC is a powerful approach which uses statistical methods to monitor and control a process, ensuring optimal efficiency and high-quality output.
We will dig into the depths of SPC, shedding light on its key elements, applications, benefits, and challenges.
The History of Statistical Process Control
SPC has its origins in the early 1920s, when Dr. Walter A. Shewhart of Bell Laboratories invented the notion of control charts.
Shewhart’s pioneering work laid the groundwork for modern quality control and gave rise to the statistical quality control area.
SPC has evolved and matured throughout time, thanks to contributions from quality gurus such as W. Edwards Deming, who popularized the concept during Japan’s post-WWII industrial reconstruction.
SPC was integrated into broader quality management systems and methodologies such as Total Quality Management (TQM) and Six Sigma in the 1980s and 1990s.
Today, SPC is a cornerstone of quality control, extensively utilized across industries ranging from manufacturing to healthcare, and it is evolving in tandem with technological and data analysis advances.
The Concept of Statistical Process Control

At its core, SPC is about understanding and reducing variability in processes. It uses statistical methods to identify special causes of variation, allowing for their elimination, and to monitor the impact of process improvement changes.
The goal is to ensure that the process remains stable and predictable, producing consistent, high-quality output.
Key Elements of Statistical Process Control
Control Charts
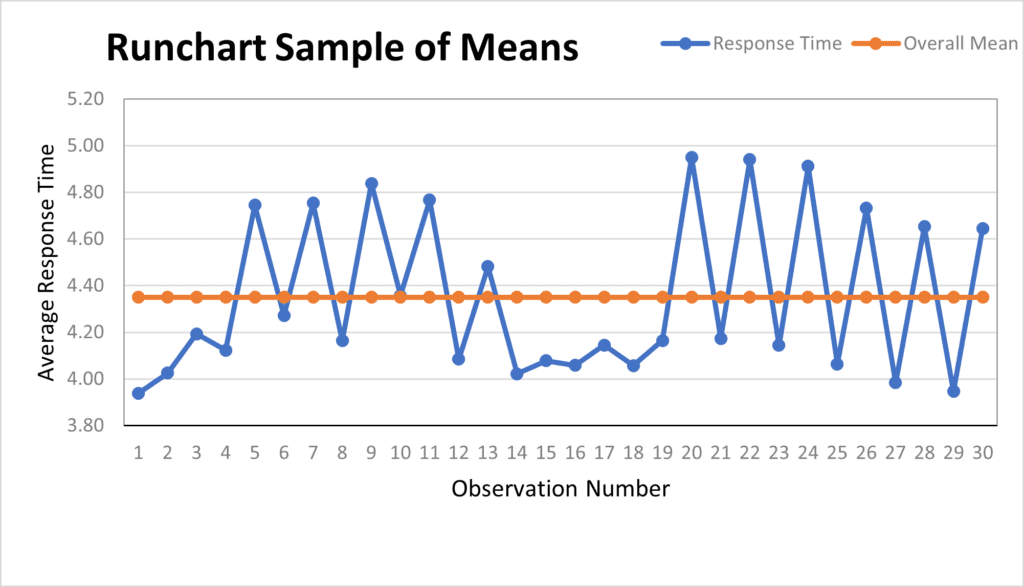
Control charts, also known as Shewhart charts, are fundamental to Statistical Process Control. They provide a visual representation of how a process changes over time, allowing for easy detection of any variations that might affect the quality of the output.
A control chart consists of points representing a statistic (such as the mean, range, or count of a variable) from a sample of a process. These points are plotted in time order.
The chart has three key components:
- Central Line: This line represents the average or mean of the statistic you’re tracking. It serves as a reference point for detecting shifts or trends in the process.
- Upper Control Limit (UCL): This line is set a certain distance above the central line and represents the upper boundary of acceptable variation. Points that fall above this line indicate that the process may be out of control due to special causes.
- Lower Control Limit (LCL): Similarly, this line is set a certain distance below the central line and represents the lower boundary of acceptable variation. Points that fall below this line also suggest that the process may be out of control.
Monitoring the process and interpreting the control chart, you can identify trends, shifts, or cycles that indicate a significant change in the process. This allows you to take corrective action before defects occur.
Process Capability
Process capability is a statistical term that quantifies a process’s ability to produce output within specified boundaries.
It indicates how successfully your process can match the requirements of your customer or industry standards.
Process capability is typically expressed as a capability index, such as Cp or Cpk.
Both indices compare the width of the process variation (as measured by the process standard deviation, sigma) to the width of the specification.
Cp: This index measures the potential capability of a process to meet specifications. It’s the ratio of the specification range to the process range. A higher Cp value indicates a more capable process.
Cp doesn’t consider the process mean and assumes that the process is centered within the specification limits.
Cpk: This index measures the actual capability of the process, considering both the process variation and the process mean.
It’s the minimum of two ratios: the distance from the process mean to the upper specification limit divided by 3 sigma, and the distance from the process mean to the lower specification limit divided by 3 sigma.
A higher Cpk value indicates a more capable process, and a process is considered capable if the Cpk is greater than 1.33, according to many industry standards.
Understanding and monitoring your process capability, you can ensure that your process is capable of producing output that meets specifications, leading to higher quality and customer satisfaction.
Sampling and Data: SPC relies on data collected from the process. Rather than inspecting every single item, a sample is taken, and control limits are calculated based on this sample data.
Analysis of Patterns on Control Charts: The interpretation of control charts involves looking for patterns or trends that indicate the process is not in control. These could be points outside the control limits, or certain patterns within the limits.
Stability and Normality: For a process to be predictable, it must be stable over time. This is assessed using control charts.
Many statistical calculations assume a normal distribution of data.
Continuous Improvement: SPC is not a one-time activity. It’s part of a cycle of continuous improvement, where the process is regularly reviewed and adjusted, as necessary.
The Application of Statistical Process Control

Statistical Process Control (SPC) is a versatile methodology that finds application in a myriad of industries. Its principles are universal, making it adaptable to different sectors, each with its unique set of processes and quality standards.
Manufacturing: SPC is most commonly associated with the manufacturing industry. It is used to monitor and control various production processes to ensure consistent quality and efficiency.
For instance, in an automotive assembly line, SPC might be used to control the torque applied to bolts, the thickness of paint applied to car bodies, or the dimensions of components.
Keeping these parameters within specified limits, manufacturers can reduce defects, minimize rework, and scrap, and ensure the production of high-quality products.
Healthcare: In the healthcare sector, SPC plays a crucial role in improving patient care and outcomes.
It can be used to monitor and improve various processes such as patient wait times, surgical outcomes, infection rates, and medication errors.
Identifying and eliminating sources of variation, healthcare providers can enhance the quality of care and patient satisfaction.
Software Development: In the realm of software development, SPC can be used to control and improve processes such as coding, testing, and bug fixing.
For example, a control chart could be used to track the number of bugs detected during software testing over time.
If the process goes out of control, indicating a surge in bugs, corrective action can be taken to identify and address the root cause.
Supply Chain and Logistics: SPC is also useful in managing supply chains and logistics.
It can be used to control and improve processes such as order fulfillment, delivery times, and inventory management.
Keeping these processes in control, companies can ensure timely delivery, reduce stockouts and overstocking, and improve overall customer service.
Food and Beverage Industry: In the food and beverage industry, SPC can help ensure consistency in taste, texture, and other quality attributes.
For example, a brewery might use SPC to control the alcohol content in its beer, ensuring a consistent product that meets legal and consumer expectations.
Energy Sector: In the energy sector, SPC can be used to monitor and control processes such as power generation, fuel consumption, and emissions.
This can help energy companies improve efficiency, reduce waste, and comply with environmental regulations.
Even for all these different applications, the fundamental principles of SPC remain the same: monitor the process, identify sources of variation, and take corrective action as needed.
Doing so, the organizations can improve their processes, enhance product or service quality, and deliver more value to their customers.
The Role of SPC in Six Sigma and PDCA Cycle

Statistical Process Control (SPC) is not just a standalone methodology. It’s a powerful tool that can be integrated into broader quality management and process improvement frameworks.
Two such frameworks where SPC plays a pivotal role are Six Sigma and the Plan-Do-Check-Act (PDCA) cycle.
Six Sigma and SPC
Six Sigma is a data-driven methodology aimed at reducing defects and improving process quality.
It follows a structured approach known as DMAIC (Define, Measure, Analyze, Improve, Control). SPC comes into play particularly in the Control phase of this approach.
In the Control phase, the improved process is monitored using control charts to ensure that performance remains within acceptable limits and that the gains from the Improve phase are sustained.
The control charts serve as an early warning system, allowing for corrective action to be taken before a process goes out of control and defects occur.
But the role of SPC in Six Sigma isn’t limited to the Control phase.
In the Measure and Analyze phases, SPC tools such as histograms and scatter plots can be used to understand process variation and identify relationships between variables.
Process capability indices, another SPC tool, can be used to assess whether a process is capable of meeting specifications.
PDCA Cycle and SPC
The Deming cycle, commonly known as the Plan-Do-Check-Act (PDCA) cycle, is a four-step model for continuous improvement. SPC fits neatly into this cycle, providing a systematic and objective way to monitor process performance and guide improvement efforts.
In the Plan phase, control charts can be used to understand the current process performance and identify opportunities for improvement.
In the Do phase, changes are made to the process, and these changes can be tracked using control charts to ensure they’re having the desired effect.
The Check phase is where SPC really shines. Here, control charts are used to assess the impact of the changes made in the Do phase.
Comparing process performance before and after the change, one can determine whether the change led to an improvement.
In the Act phase, if the change is deemed successful, it’s standardized and implemented on a wider scale. Control charts continue to be used to monitor the process and ensure that performance remains stable.
In both Six Sigma and the PDCA cycle, SPC provides a rigorous, data-driven approach to process monitoring and improvement. It ensures that decisions are based on evidence, not guesswork, and that improvements are measurable and sustainable.
Integrating SPC into these frameworks, organizations can enhance their quality management efforts and drive continuous improvement.
The Benefits of Implementing Statistical Process Control

Implementing SPC can bring numerous benefits to an organization. It leads to improved process efficiency, as the identification and elimination of special causes of variation reduce variability and waste. This can result in significant cost savings.
SPC enhances product quality. By keeping the process in control, the output is more likely to meet specifications, leading to fewer defects and higher customer satisfaction.
It also provides a data-driven method for continuous improvement.
It enables organizations to make informed decisions about process changes, reducing the risk of unintended consequences and ensuring that improvements are based on solid evidence.
Challenges and Solutions in Implementing SPC

Despite its benefits, implementing SPC is not without challenges. One common obstacle is resistance to change, especially if staff are not familiar with statistical methods.
This can be overcome by providing training and demonstrating the benefits of SPC.
Another problem is assuring data quality. Poor data quality can lead to erroneous findings and judgments. A solid data collecting, and management system must be in place.
Implementing SPC requires a commitment to continuous improvement. It’s not a one-off project, but an ongoing effort that requires time and resources.
The payoff in terms of improved quality and efficiency can be well worth the investment.
Final Thoughts

Statistical Process Control is an powerful tool for quality control and process optimization, as well as a tried-and-true approach that can benefit any firm. It has a century of history and remains relevant and helpful in today’s data-driven society.
Understanding and implementing SPC is a process of continual learning and improvement that can result in benefits such as higher productivity, improved product quality, and increased customer satisfaction for a business.
While there may be obstacles along the road, the trip to statistical control can result in considerable rewards.
For further reading, we recommend books such as “Statistical Process Control for Quality Improvement” by J.R. Evans and W.M. Lindsay, and “Understanding Statistical Process Control” by D.J. Wheeler and D.S. Chambers.
FAQ
Q: What is Statistical Process Control (SPC)?
A: Statistical Process Control (SPC) is a quality control method that monitors and controls a process using statistical methodologies. This contributes to the process’s efficiency, resulting in more specification-conforming products with less waste (rework or scrap).
Q: What are control charts in SPC?
A: Control charts are an important tool in SPC. They are graphs that are used to investigate how a process changes over time. The data is shown in chronological sequence. A control chart always includes a central line representing the average, an upper line representing the upper control limit, and a lower line representing the lower control limit. These lines are based on historical data.
Q: What is process capability?
A: Process capacity is a statistical assessment of a particular characteristic’s inherent process variability. It is calculated by dividing the specification width by the process variance. It indicates how successfully your process can match the requirements of your customer or industry standards.
Q: How is SPC used in Six Sigma?
A: In Six Sigma, a methodology aimed at reducing defects and improving quality, SPC is used in the “Control” phase to monitor process performance and ensure improvements are sustained. It’s also used in the “Measure” and “Analyze” phases to understand process variation and identify relationships between variables.
Q: What are the benefits of implementing SPC?
A: Implementing SPC can lead to improved process efficiency, enhanced product quality, and increased customer satisfaction. By identifying and eliminating sources of variation, SPC can reduce defects, minimize waste, and ensure that your process is capable of producing output that meets specifications.
Q: What are the challenges in implementing SPC and how can they be overcome?
A: Common challenges in implementing SPC include resistance to change, especially if staff are not familiar with statistical methods, and ensuring the quality of data. These can be overcome by providing training, demonstrating the benefits of SPC, and having a robust data collection and management system in place.
Q: Can SPC be used in industries other than manufacturing?
A: Yes, SPC is applicable in any industry where the output of a process can be measured. This includes healthcare, software development, supply chain and logistics, the food and beverage industry, and the energy sector, among others.
Bio

Ronnie Patterson
Ronnie Patterson, founder of MagnÜron, is a multifaceted entrepreneur with a diverse background in music, electronics engineering, and engineering management. Drawing on experience across various industries, He offers expertise in SEO, operations, and strategy to help businesses thrive. Possessing a unique perspective and unwavering commitment to collaboration, and ideal partner for growth and success.